BOM weekly rainfall update 13 October 2026 + outlook map
The headline 5-25mm totals hide which districts missed their October median and what that gap should change in this week's farm decisions.
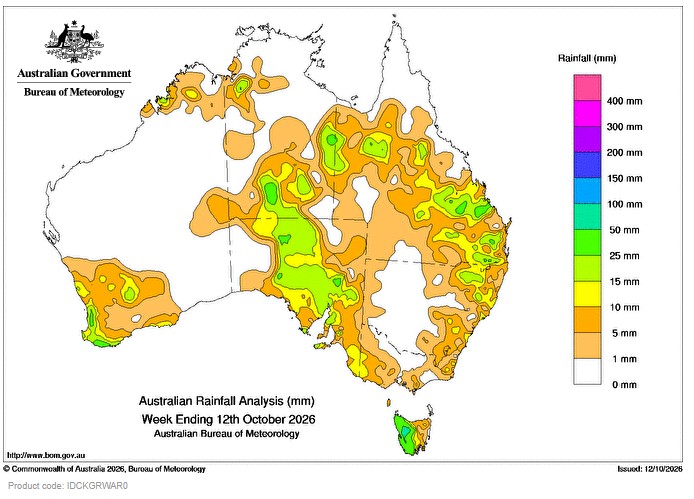
Did the rain that fell on your place last week actually match what October normally delivers there, or did it just look like enough from the kitchen window?
That question matters more than the raw weekly total. A map showing 5 to 25 millimetres across a wide swathe of the country tells you it rained somewhere. It does not tell you whether a given paddock in the Western Downs, the Wimmera, the central tablelands of New South Wales or the Avon wheatbelt in Western Australia got anywhere near its long-term October median. Those are very different pieces of information, and this week the gap between them is doing most of the work that actually affects decisions on the ground.
Why the median comparison matters more than the weekly total
October sits inside the window when a lot of southern and central cropping country is either finishing a winter crop, deciding on a late pasture sow, or weighing up whether dams and bores will carry stock through summer. A weekly total on its own is a snapshot. The median comparison is a trend line. If a district’s October median is, say, a moderate figure built up from decades of records, and this week’s fall landed well under that figure, the paddock is still running a deficit even though the forecast map showed “widespread light falls.” Farmers reading only the headline totals can walk away thinking the season is on track when, compared with what that specific location normally gets in mid-October, it is not.
Step 1: Check the weekly total against the median map, not the weekly map alone
The Bureau publishes separate products for actual rainfall and for rainfall deciles or percentage-of-median comparisons. The habit worth building is opening both side by side rather than relying on the single weekly totals map that gets shared most widely. A town can sit inside the 5-25mm band and still be running at well under half of what it would normally expect for this point in October, especially in districts where the October median itself is already modest.
Tip: Note the decile category, not just the millimetre figure. A fall that looks respectable in absolute terms can still sit in the lowest deciles for that particular location and time of year, which is the number that actually describes how unusual the shortfall is.
Step 2: Work out which districts are the likely laggards this week
Without naming exact millimetre deficits that aren’t yet confirmed, the pattern worth watching for is consistent with most patchy spring weeks: inland cropping belts and rain-shadow districts tend to miss out more often than coastal and near-coastal catchments when a system is light and scattered. Areas that depend on a single front moving through cleanly, rather than a broader low with embedded troughs, are the ones most likely to have recorded totals well under their October median this time around. If your district sits inland of a coastal range, or in a typical rain-shadow zone, treat this week’s fall with more scepticism until you’ve checked the median comparison for your own town, not just the regional average.
Tip: Don’t assume a neighbouring town’s total applies to you. October rainfall can vary sharply over short distances, especially where falls come from isolated showers rather than a broad frontal band.
Step 3: Translate the shortfall into a soil moisture question, not just a rainfall one
Five to twenty-five millimetres can mean very different things depending on what the soil profile looked like beforehand. On a profile that already had reasonable subsoil moisture from earlier winter falls, even a modest top-up can be enough to carry a maturing crop or support pasture growth for another week or two. On a profile that went into the week already short, the same rainfall largely wets the surface, feeds evaporation, and does little for anything with roots below the first few centimetres. The Bureau’s root-zone soil moisture products exist precisely to answer this, and they are the piece most people skip when they only glance at the weekly rainfall map.
Tip: If you can, compare this week’s rainfall figure with what the local evaporation rate has been running at. A light fall during a run of warm, windy days disappears from the topsoil far faster than the same fall during cooler, overcast conditions.
Step 4: Separate rainfall from dam and storage data
This is where a rainfall update, however detailed, stops being the right tool. Weekly rainfall figures say nothing about how full a regional dam, farm turkey nest, or irrigation storage currently is. Those numbers come from separate state water authority reports and require their own check. A district can record a reasonable rainfall week and still have a storage sitting on a long, slow drawdown from a dry spring, simply because inflows depend on catchment-wide totals over months, not a single week’s falls.
Tip: If your decision this week involves irrigation scheduling, water allocation planning, or stock water security, treat the rainfall update as background context only and go straight to your water authority’s storage report for the actual numbers that matter.
Step 5: Decide whether 5-25mm is enough to act on
For most purposes at this stage of the season, a fall in that range is a top-up, not a turning point. It can be enough to:
- Extend the window for a maturing winter crop by reducing heat and moisture stress for a few extra days
- Support germination of a pasture oversow if the ground was already close to moist enough
- Settle dust and reduce short-term fire risk in cured pasture country
It is usually not enough to:
- Reverse an existing subsoil moisture deficit built up over several dry months
- Materially change a decision to destock or hold stock in a marginal season
- Justify delaying a planned late planting on the assumption that “more will follow”
Who this update is not useful for
This kind of weekly rainfall comparison is not the right tool for anyone making decisions based on irrigation allocation, dam levels, river flow for stock and domestic licences, or groundwater bore trends. It also won’t help with frost risk planning, which depends on temperature and moisture interaction rather than rainfall totals alone. Treat it as one input among several, not the whole picture.
Common mistakes to avoid
- Reading the weekly total map and assuming it applies evenly across a whole region rather than checking your specific town
- Skipping the median or decile comparison and judging the week only against “did it rain”
- Confusing a light topsoil wetting with a genuine improvement in root-zone moisture
- Using rainfall figures as a proxy for dam or storage levels when they are not the same data at all
- Making a planting or destocking decision on one week’s figures instead of the rolling pattern over the past month
Quick recap
- 5-25mm weekly totals can still sit well under the October median in specific inland and rain-shadow districts
- Check the decile or percentage-of-median map alongside the weekly total, not instead of it
- Soil moisture response depends on what the profile looked like before the rain, not just how much fell
- Dam and storage levels need their own separate check and are not reflected in rainfall totals
- At this time of year, 5-25mm is generally a top-up rather than a season-changing event for most cropping and grazing decisions

Member Stories
Breeder profiles and member stories from across the Australian Wiltshire Horn community.